# 示例:热度图渲染
使用热度图来表示点数据的密集程度是一种很直观的可视化方式,但是在数据量比较大的时候,直接使用客户端渲染全部数据很可能带来性能问题。HeyCloud 的渲染 API 中提供了将数据在服务端进行预先统计的接口,可以降低传输到客户端的数据量,提升渲染的效率。
# 1. 搭建页面框架
首先我们创建一个名为 heat-viz.html 的页面,这里我们引入 OpenLayers,在页面上显示一个地图组件,并加载一个开放底图:
<!DOCTYPE html>
<html>
<meta charset="utf-8">

<head>
  <link rel="stylesheet" href="https://cdn.jsdelivr.net/gh/openlayers/openlayers.github.io@master/en/v6.5.0/css/ol.css" type="text/css">
  <script src="https://cdn.jsdelivr.net/gh/openlayers/openlayers.github.io@master/en/v6.5.0/build/ol.js"></script>
  <script src="https://cdn.jsdelivr.net/npm/vue@2"></script>
</head>

<body>
  <div id="app">
    <div id="map" style="width: 600px; height: 600px"></div>
  </div>

  <script>
  var app = new Vue({
    el: '#app',
    data: {
    },

    mounted: function() {
      const map = new ol.Map({
        target: 'map',
        layers: [
          new ol.layer.Tile({
            source: new ol.source.OSM(),
          }),
        ],
        view: new ol.View({
          center: ol.proj.fromLonLat([140, 36]),
          zoom: 7,
        }),
      });
    }
  });
  </script>
</body>

</html>
# 2. 添加一个热度图层,并指定样式
然后,我们选择一个包含有大量点数据的矢量数据集「6072dd08-5f69-4be2-8530-ee5ef5200a37」作为数据源进行图层渲染。热度图层的配置比较简单,只要在渲染样式中指定渲染类型为「marker-heat」就可以了,渲染配置示例如下。
渲染配置中的
xGrids和yGrids表示渲染时划分的统计格网数,默认值为64,也就是说对于尺寸为 256 像素的瓦片,每4个像素内的数据会统计到同一个点上去。
{
  "datasource": {
    "type": "vdataset",
    "source": "6072dd08-5f69-4be2-8530-ee5ef5200a37",
  },
  "style": {
    "type": "marker-heat",
    "xGrids": 64,
    "yGrids": 64,
  },
}
通过 POST 渲染配置得到图层的uid后,就可以构造相应的 URL 来访问热度数据:
const heatLayer = new ol.layer.Heatmap({
  source: new ol.source.Vector({
    format: new ol.format.GeoJSON({
      dataProjection: ol.proj.get('EPSG:3857'),
    }),
    url: (extent, resolution, projection) => {
      const bbox = extent.join(',');
      return `http://localhost:9000/heycloud/api/render/layer/${uid}/${bbox}/256/256/heat?x-heycloud-account-id=${this.accountId}`;
    },
    strategy: new ol.loadingstrategy.tile(ol.tilegrid.createXYZ()),
  }),
  weight: 'heat',
});
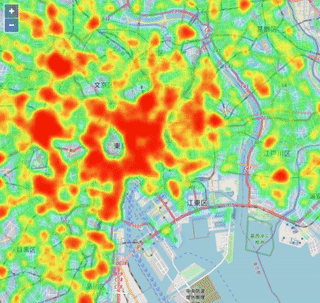
这时,页面就可以显示出下面样子的热度图来:
# 3. 根据不同的 zoom 级别加载不同的热度图层
为了有更好的性能,这里在前端是采用瓦片策略来加载热度数据的,这和一次性加载所有的数据有很大不同。如果一次性加载了所有数据,那么完全依赖客户端去计算所有数据的渲染效果;而采用了瓦片策略加载热度数据,不同级别的热度数据是经过后台统计的,不同 zoom 级别的热度数据是不可以混用的,因此需要在地图缩放时判断热度图层是否是当前的级别下的数据,如果不是则应该进行切换。
<!DOCTYPE html>
<html>
<meta charset="utf-8">

<head>
  <link rel="stylesheet" href="https://cdn.jsdelivr.net/gh/openlayers/openlayers.github.io@master/en/v6.5.0/css/ol.css" type="text/css">
  <script src="https://cdn.jsdelivr.net/gh/openlayers/openlayers.github.io@master/en/v6.5.0/build/ol.js"></script>
  <script src="https://cdn.jsdelivr.net/npm/vue@2"></script>
</head>

<body>
  <div id="app">
    <div id="map" style="width: 600px; height: 600px"></div>
  </div>

  <script>
  var app = new Vue({
    el: '#app',
    data: {
      accountId: '3897a3d3-3d32-4b6d-a138-489657278b70',
      vdatasetId: '6072dd08-5f69-4be2-8530-ee5ef5200a37',
    },

    mounted() {
      const map = new ol.Map({
        target: 'map',
        layers: [
          new ol.layer.Tile({
            source: new ol.source.OSM(),
          }),
        ],
        view: new ol.View({
          center: ol.proj.fromLonLat([140, 36]),
          zoom: 7,
        }),
      });

      fetch('http://localhost:9000/heycloud/api/render/layer', {
          method: 'POST',
          mode: 'cors',
          headers: {
            'content-type': 'application/json',
            'x-heycloud-account-id': this.accountId,
          },
          body: JSON.stringify({
            'datasource': {
              'type': 'vdataset',
              'source': this.vdatasetId,
            },
            'style': {
              "type": "marker-heat",
              "xGrids": 64,
              "yGrids": 64,
            },
          }),
        })
        .then(resp => resp.json())
        .then(resp => {
          const { uid } = resp.result;

          const tileGrid = ol.tilegrid.createXYZ({
            maxZoom: 16,
          });

          const heatLayers = {};
          const getHeatLayer = (z) => {
            heatLayers[z] = heatLayers[z] || new ol.layer.Heatmap({
              source: new ol.source.Vector({
                format: new ol.format.GeoJSON({
                  dataProjection: ol.proj.get('EPSG:3857'),
                }),
                url: (extent, resolution, projection) => {
                  const bbox = extent.join(',');
                  return `http://localhost:9000/heycloud/api/render/layer/${uid}/${bbox}/256/256/heat?x-heycloud-account-id=${this.accountId}`;
                },
                strategy: new ol.loadingstrategy.tile(tileGrid),
              }),
              weight: 'heat',
            });

            return heatLayers[z];
          };

          const z = tileGrid.getZForResolution(map.getView().getResolution());
          let heatLayer = getHeatLayer(z);

          let currentZ;
          map.getView().on('change:resolution', () => {
            const z = tileGrid.getZForResolution(map.getView().getResolution());
            if (currentZ !== z) {
              currentZ = z;

              map.removeLayer(heatLayer);

              heatLayer = getHeatLayer(z);
              map.addLayer(heatLayer);
            }
          });

          map.addLayer(heatLayer);
        });
    }
  });
  </script>
</body>

</html>
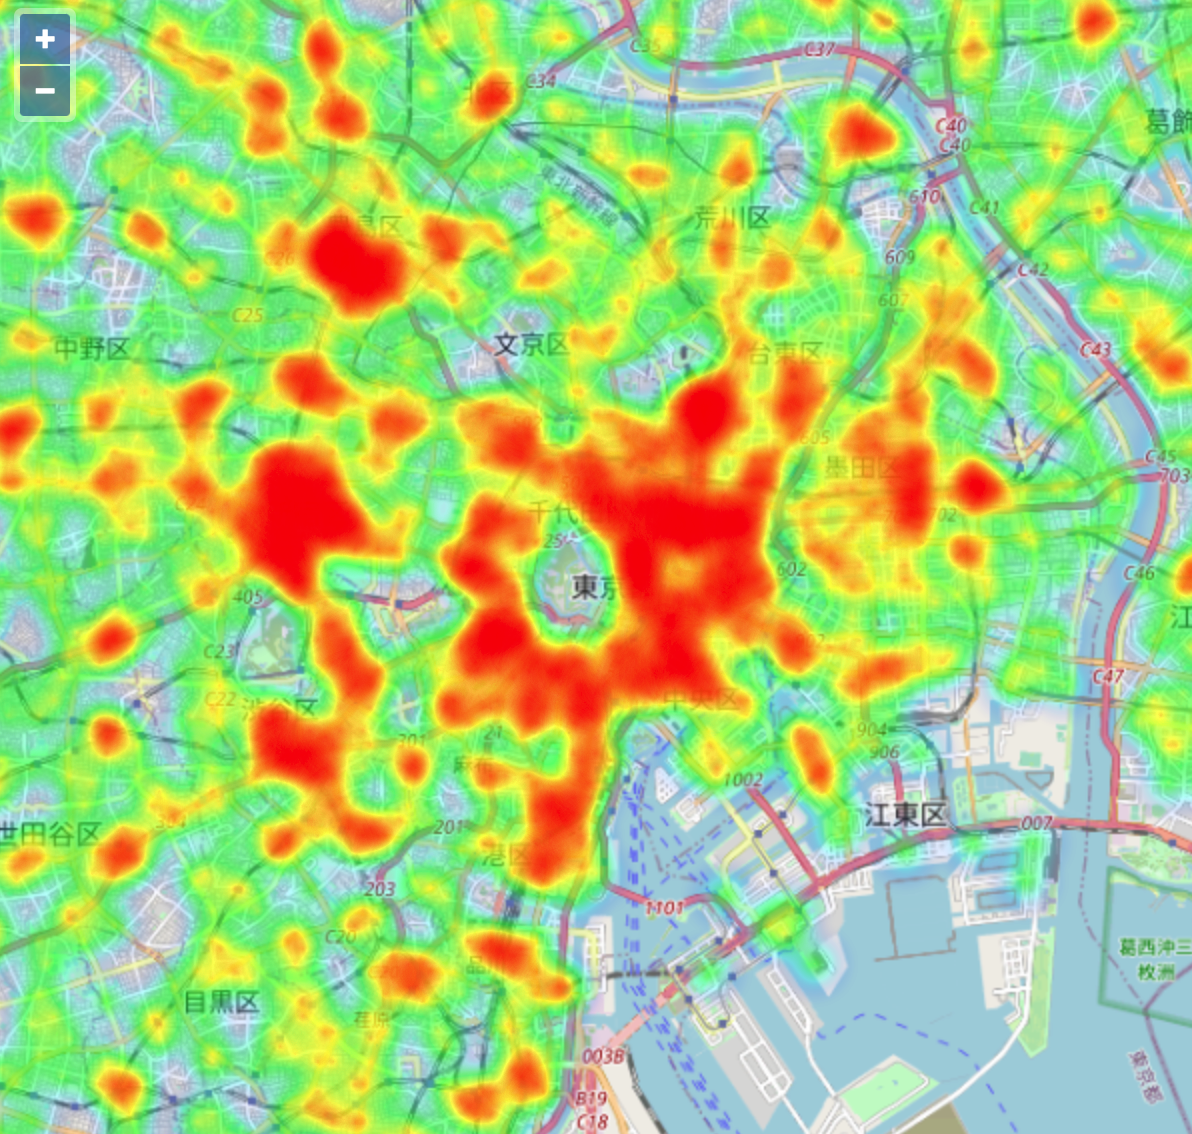
这样的页面,地图缩放的效果如下: