# 示例:将数据上图可视化
设想我们正在开发一个将用户数据可视化的应用,在这个应用中我们已经能够查询用户的数据,现在我们需要在一个页面中将这个数据进行动态可视化。
示例使用 Vue 作为开发框架
# 1. 搭建页面框架
首先我们创建一个名为 data-viz.html 的页面,这里我们引入 OpenLayers,在页面上显示一个地图组件,并加载一个开放底图:
<!DOCTYPE html>
<html>
<meta charset="utf-8">

<head>
  <link rel="stylesheet" href="https://cdn.jsdelivr.net/gh/openlayers/openlayers.github.io@master/en/v6.5.0/css/ol.css" type="text/css">
  <script src="https://cdn.jsdelivr.net/gh/openlayers/openlayers.github.io@master/en/v6.5.0/build/ol.js"></script>
  <script src="https://cdn.jsdelivr.net/npm/vue@2"></script>
</head>

<body>
  <div id="app">
    <div id="map" style="width: 600px; height: 600px"></div>
  </div>

  <script>
  var app = new Vue({
    el: '#app',
    data: {
      map: null,
    },

    mounted: function() {
      this.map = new ol.Map({
        target: 'map',
        layers: [
          new ol.layer.Tile({
            source: new ol.source.OSM(),
          }),
        ],
        view: new ol.View({
          center: ol.proj.fromLonLat([140, 40]),
          zoom: 5,
        }),
      });
    }
  });
  </script>
</body>

</html>
# 2. 添加一个数据图层,使用简单样式渲染
渲染一个数据图层的主要步骤有两个:
- 向
/render/layer接口 POST 一个渲染配置,这会生成一个唯一的图层,返回的结果中包含这个图层的唯一标识uid - 使用这个
uid加载图层瓦片到前端地图中
下面的代码执行了上述两个步骤:
fetch('http://localhost:9000/heycloud/api/render/layer', {
    method: 'POST',
    mode: 'cors',
    headers: {
      'content-type': 'application/json',
      'x-heycloud-account-id': this.accountId,
    },
    body: JSON.stringify({
      'datasource': {
        'type': 'vdataset',
        'source': this.vdatasetId,
      },
      'style': {
        'type': 'polygon-simple',
        'fillColor': '#000',
        'fillOpacity': 0.6,
        'outlineColor': '#fff',
        'outlineWidth': 0.6,
      },
    }),
  })
  .then(resp => resp.json())
  .then(resp => {
    const { uid } = resp.result;

    this.renderLayer = new ol.layer.Tile({
      source: new ol.source.XYZ({
        url: `http://localhost:9000/heycloud/api/render/layer/${uid}/tile/{z}/{x}/{y}/${ol.has.DEVICE_PIXEL_RATIO||1}/image.png?x-heycloud-account-id=${this.accountId}`,
        crossOrigin: '*',
      }),
    });

    this.map.addLayer(this.renderLayer);
  });
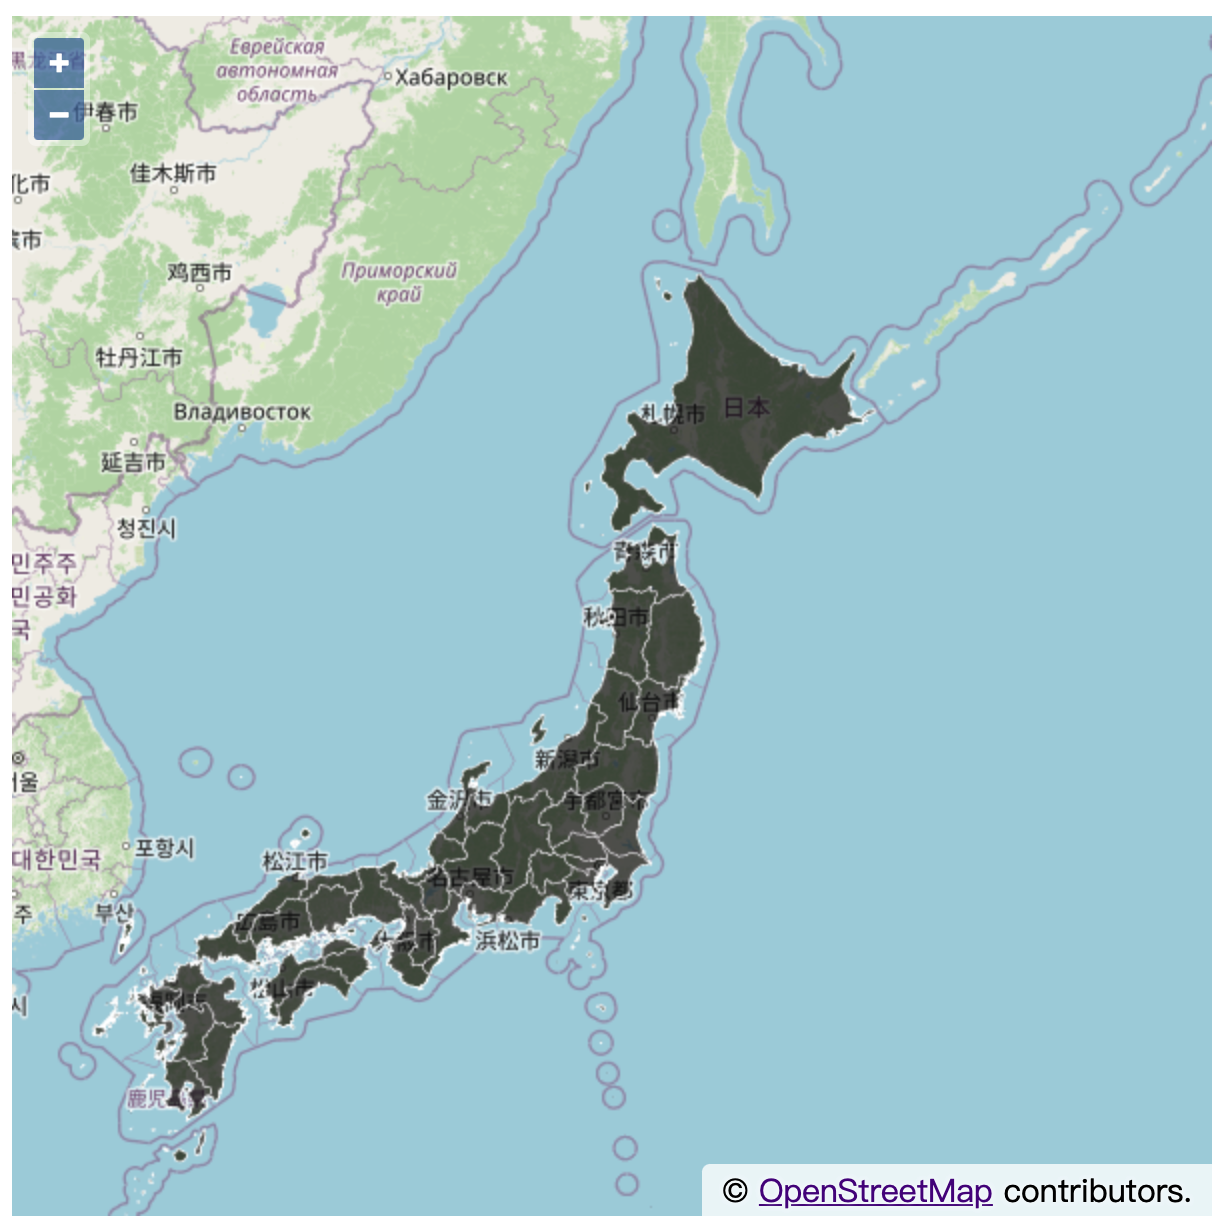
这时能够看到的页面效果如下:
# 3. 添加这个数据的 UTFGrid 图层,使其可以响应鼠标事件
this.utfGridLayer = new ol.layer.Tile({
  source: new ol.source.UTFGrid({
    tileJSON: {
      grids: [`http://localhost:9000/heycloud/api/render/layer/${uid}/tile/{z}/{x}/{y}/utfgrid?x-heycloud-account-id=${this.accountId}&fields=id,nl_name`],
    },
  }),
});

this.map.addLayer(this.utfGridLayer);

this.map.on('pointermove', function(evt) {
  if (evt.dragging) {
    return;
  }

  if (this.utfGridLayer) {
    const coordinate = this.map.getEventCoordinate(evt.originalEvent);

    this.utfGridLayer.getSource().forDataAtCoordinateAndResolution(
      coordinate,
      this.map.getView().getResolution(),
      data => {
        this.map.getTargetElement().style.cursor = data ? 'pointer' : '';
      });
  }
}.bind(this));

this.map.on('click', function(evt) {
  const { coordinate } = evt;

  if (this.utfGridLayer) {
    this.utfGridLayer.getSource().forDataAtCoordinateAndResolution(
      coordinate,
      this.map.getView().getResolution(),
      data => {
        if (data) {
          const rows = [];

          for (let k in data) {
            const v = data[k];
            rows.push(`<tr><th style="text-align: right;">${k}</th><td style="padding-left: 0.5rem;">${v}</td></tr>`)
          }

          popupContent.innerHTML = `<table>${rows.join('')}</table>`;
          popup.setPosition(coordinate);
        } else {
          popup.setPosition();
        }
      });
  }
}.bind(this));
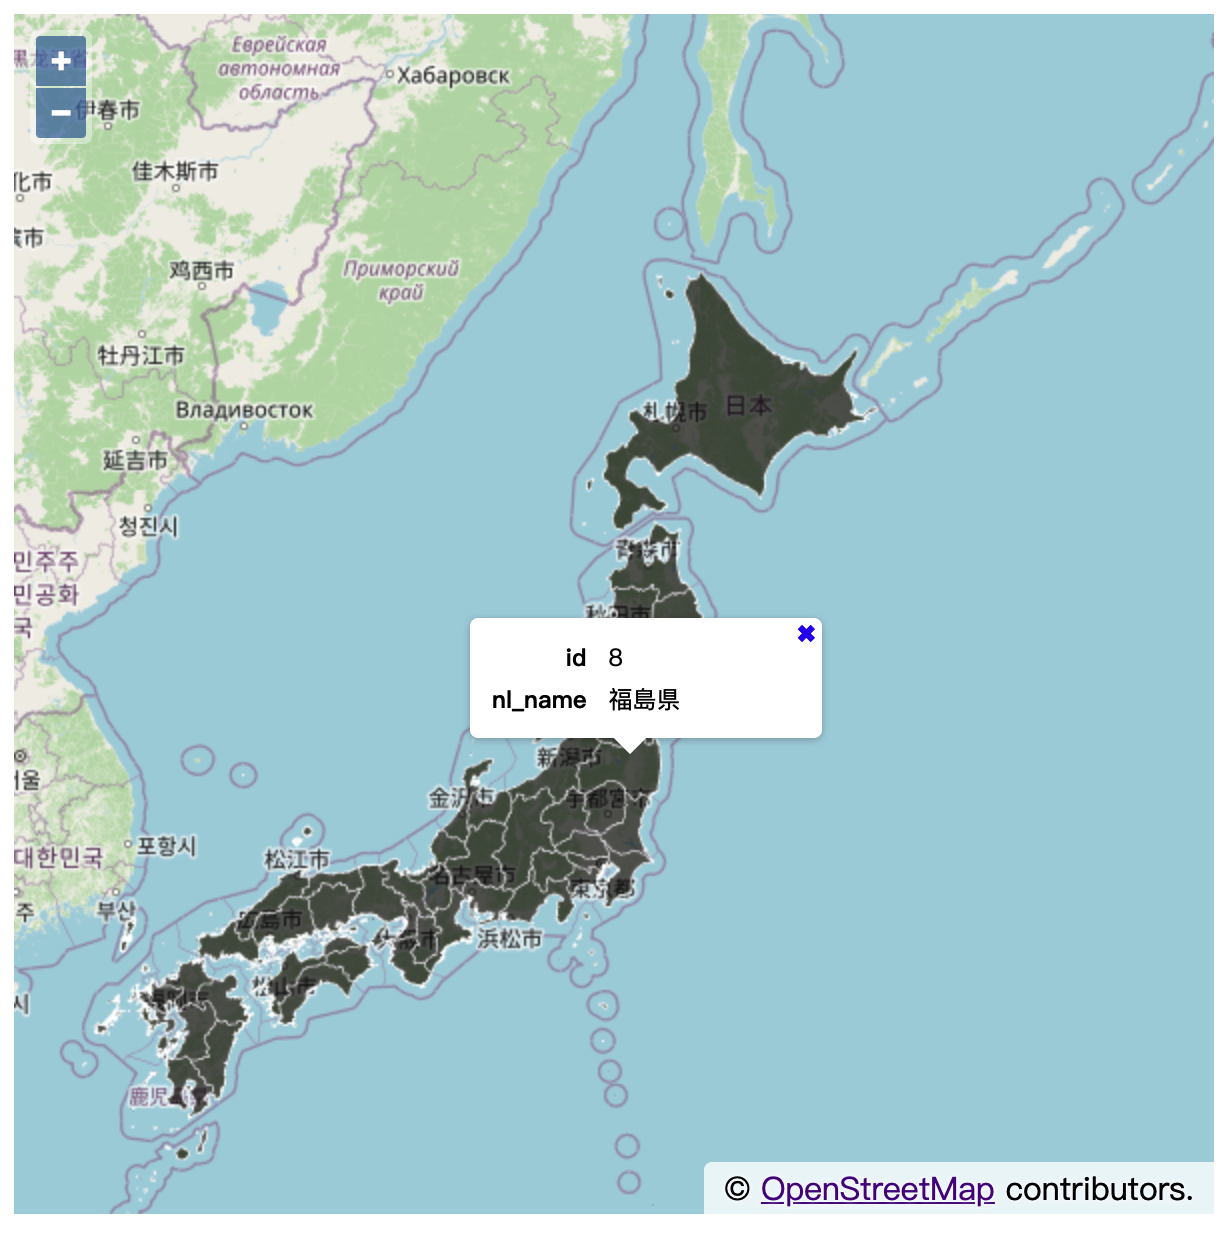
这时将鼠标移动到对象上会变成手型,点击能看到对象的属性值,页面效果如下:
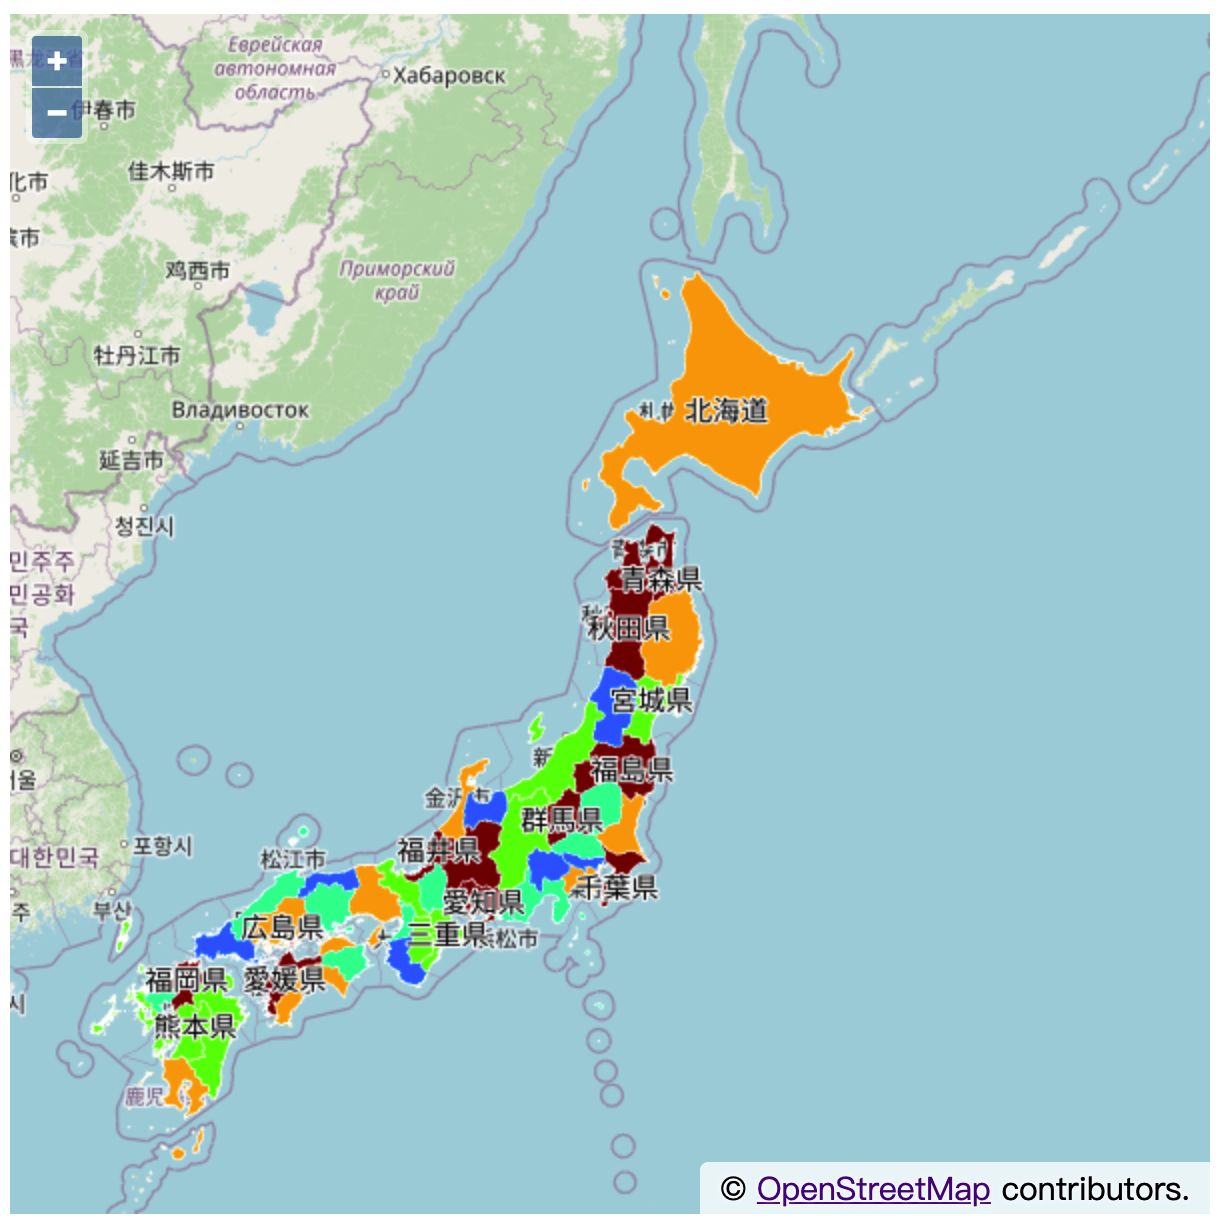
# 4. 改用分段渲染显示数据
数据的渲染取决于向render/layer接口 POST 的渲染样式,这里我们将这个数据的渲染样式改为分段渲染,并将数据的nl_name属性值显示为标注:
fetch('http://localhost:9000/heycloud/api/render/layer', {
    method: 'POST',
    mode: 'cors',
    headers: {
      'content-type': 'application/json',
      'x-heycloud-account-id': this.accountId,
    },
    body: JSON.stringify({
      'datasource': {
        'type': 'vdataset',
        'source': this.vdatasetId,
        'attrFields': ['id', 'nl_name'],
      },
      'style': {
        'type': 'polygon-choropleth',
        'field': 'id',
        'fieldBreaks': [0, 10, 20, 30, 40, 50, 60],
        'fillColors': ['#800000', '#ffa500', '#5fff00', '#00ff9b', '#0069ff', '#9100ff'],
        'fillOpacity': 1.0,
        'outlineColor': '#fff',
        'outlineWidth': 0.6,
        'labelField': 'nl_name',
        'labelPlacement': 'interior',
        'labelSize': 14,
        'labelHaloRadius': 1,
      },
    }),
  })
# 5. 最终的效果和代码
页面效果如下图:
最终的页面代码:
<!DOCTYPE html>
<html>
<meta charset="utf-8">

<head>
  <link rel="stylesheet" href="https://cdn.jsdelivr.net/gh/openlayers/openlayers.github.io@master/en/v6.5.0/css/ol.css" type="text/css">
  <script src="https://cdn.jsdelivr.net/gh/openlayers/openlayers.github.io@master/en/v6.5.0/build/ol.js"></script>
  <script src="https://cdn.jsdelivr.net/npm/vue@2"></script>
  <style type="text/css">
  .ol-popup {
    position: absolute;
    background-color: white;
    box-shadow: 0 1px 4px rgba(0, 0, 0, 0.2);
    font-size: 0.7rem;
    padding: 0.5rem;
    border-radius: 4px;
    bottom: 0.5rem;
    left: calc(-5rem - 1px);
    min-width: 10rem;
  }

  .ol-popup:after, .ol-popup:before {
    top: 100%;
    border: solid transparent;
    content: " ";
    height: 0;
    width: 0;
    position: absolute;
    pointer-events: none;
  }

  .ol-popup:after {
    border-top-color: white;
    border-width: 0.5rem;
    left: 5rem;
    margin-left: -0.5rem;
  }

  .ol-popup:before {
    border-top-color: #cccccc;
    border-width: 0.5rem;
    left: 5rem;
    margin-left: -0.5rem;
  }

  .ol-popup-closer {
    text-decoration: none;
    position: absolute;
    line-height: 1rem;
    top: 0;
    right: 0.2rem;
  }

  .ol-popup-closer:after {
    content: "✖";
  }
  </style>
</head>

<body>
  <div id="app">
    <div id="map" style="width: 600px; height: 600px"></div>

    <div id="popup" class="ol-popup">
      <a href="javascript:;" id="popup-closer" class="ol-popup-closer"></a>
      <div id="popup-content"></div>
    </div>
  </div>

  <script>
  var app = new Vue({
    el: '#app',
    data: {
      map: null,
      renderLayer: null,
      utfGridLayer: null,
      popup: null,

      accountId: '3897a3d3-3d32-4b6d-a138-489657278b70',
      vdatasetId: 'a444f5c3-c384-4ea2-8543-22295fbe49cb',
    },

    mounted() {
      const popupContainer = document.getElementById('popup');
      const popupContent = document.getElementById('popup-content');
      const popupCloser = document.getElementById('popup-closer');

      const popup = this.popup = new ol.Overlay({
        element: popupContainer,
      });

      popupCloser.onclick = function() {
        popup.setPosition();
        popupCloser.blur();
        return false;
      };

      this.map = new ol.Map({
        target: 'map',
        layers: [
          new ol.layer.Tile({
            source: new ol.source.OSM(),
          }),
        ],
        view: new ol.View({
          center: ol.proj.fromLonLat([140, 40]),
          zoom: 5,
        }),
        overlays: [popup],
      });

      fetch('http://localhost:9000/heycloud/api/render/layer', {
          method: 'POST',
          mode: 'cors',
          headers: {
            'content-type': 'application/json',
            'x-heycloud-account-id': this.accountId,
          },
          body: JSON.stringify({
            'datasource': {
              'type': 'vdataset',
              'source': this.vdatasetId,
              'attrFields': ['id', 'nl_name'],
            },
            'style': {
              'type': 'polygon-choropleth',
              'field': 'id',
              'fieldBreaks': [0, 10, 20, 30, 40, 50, 60],
              'fillColors': ['#800000', '#ffa500', '#5fff00', '#00ff9b', '#0069ff', '#9100ff'],
              'fillOpacity': 1.0,
              'outlineColor': '#fff',
              'outlineWidth': 0.6,
              'labelField': 'nl_name',
              'labelPlacement': 'interior',
              'labelSize': 14,
              'labelHaloRadius': 1,
            },
          }),
        })
        .then(resp => resp.json())
        .then(resp => {
          const { uid } = resp.result;

          this.renderLayer = new ol.layer.Tile({
            source: new ol.source.XYZ({
              url: `http://localhost:9000/heycloud/api/render/layer/${uid}/tile/{z}/{x}/{y}/${ol.has.DEVICE_PIXEL_RATIO||1}/image.png?x-heycloud-account-id=${this.accountId}`,
              crossOrigin: '*',
            }),
          });

          this.map.addLayer(this.renderLayer);

          this.utfGridLayer = new ol.layer.Tile({
            source: new ol.source.UTFGrid({
              tileJSON: {
                grids: [`http://localhost:9000/heycloud/api/render/layer/${uid}/tile/{z}/{x}/{y}/utfgrid?x-heycloud-account-id=${this.accountId}&fields=id,nl_name`],
              },
            }),
          });

          this.map.addLayer(this.utfGridLayer);
        });

      this.map.on('pointermove', function(evt) {
        if (evt.dragging) {
          return;
        }

        if (this.utfGridLayer) {
          const coordinate = this.map.getEventCoordinate(evt.originalEvent);

          this.utfGridLayer.getSource().forDataAtCoordinateAndResolution(
            coordinate,
            this.map.getView().getResolution(),
            data => {
              this.map.getTargetElement().style.cursor = data ? 'pointer' : '';
            });
        }
      }.bind(this));

      this.map.on('click', function(evt) {
        const { coordinate } = evt;

        if (this.utfGridLayer) {
          this.utfGridLayer.getSource().forDataAtCoordinateAndResolution(
            coordinate,
            this.map.getView().getResolution(),
            data => {
              if (data) {
                const rows = [];

                for (let k in data) {
                  const v = data[k];
                  rows.push(`<tr><th style="text-align: right;">${k}</th><td style="padding-left: 0.5rem;">${v}</td></tr>`)
                }

                popupContent.innerHTML = `<table>${rows.join('')}</table>`;
                popup.setPosition(coordinate);
              } else {
                popup.setPosition();
              }
            });
        }
      }.bind(this));
    }
  });
  </script>
</body>

</html>