# 示例:使用自定义的图标渲染地图
# 1. 准备自定义的图标
我们先尝试用一个自定义的图片来对多边形进行填充,这个图片需要放到 HeyCloud 的共享文件目录下,默认是数据节点的/var/heycloud-volumes/heycloud-share目录。
假设我们现在准备了一张名为icon-blue.png的图片,为了让文件更有组织,我们在该目录下先新建一个名为icons的目录,然后将这个文件放于这个目录中。因此,现在这个文件的相对路径为icons/icon-blue.png。
![]()
# 2. 用这个图片填充多边形
新建一个名为viz-by-my-icon.html的文件,内容如下:
<!DOCTYPE html>
<html>
<meta charset="utf-8">

<head>
  <link rel="stylesheet" href="https://cdn.jsdelivr.net/gh/openlayers/openlayers.github.io@master/en/v6.5.0/css/ol.css" type="text/css">
  <script src="https://cdn.jsdelivr.net/gh/openlayers/openlayers.github.io@master/en/v6.5.0/build/ol.js"></script>
  <script src="https://cdn.jsdelivr.net/npm/vue@2"></script>
</head>

<body>
  <div id="app">
    <div id="map" style="width: 600px; height: 600px"></div>
  </div>

  <script>
  var app = new Vue({
    el: '#app',
    data: {
      map: null,
      renderLayer: null,

      accountId: '3897a3d3-3d32-4b6d-a138-489657278b70',
      vdatasetId: 'a444f5c3-c384-4ea2-8543-22295fbe49cb',
    },

    mounted() {
      this.map = new ol.Map({
        target: 'map',
        view: new ol.View({
          center: ol.proj.fromLonLat([140, 40]),
          zoom: 5,
        }),
      });

      fetch('http://localhost:9000/heycloud/api/render/layer', {
          method: 'POST',
          mode: 'cors',
          headers: {
            'content-type': 'application/json',
            'x-heycloud-account-id': this.accountId,
          },
          body: JSON.stringify({
            'datasource': {
              'type': 'vdataset',
              'source': this.vdatasetId,
            },
            'style': {
              'type': 'polygon-simple',
              'fillFile': '/var/share/icons/icon-blue.png',
              'fillOpacity': 1.0,
              'outlineColor': '#fff',
              'outlineWidth': 1.2,
            },
          }),
        })
        .then(resp => resp.json())
        .then(resp => {
          const { uid } = resp.result;

          this.renderLayer = new ol.layer.Tile({
            source: new ol.source.XYZ({
              url: `http://localhost:9000/heycloud/api/render/layer/${uid}/tile/{z}/{x}/{y}/${ol.has.DEVICE_PIXEL_RATIO||1}/image.png?x-heycloud-account-id=${this.accountId}`,
              crossOrigin: '*',
            }),
          });

          this.map.addLayer(this.renderLayer);
        });
    }
  });
  </script>
</body>

</html>
页面将会呈现这样的效果:
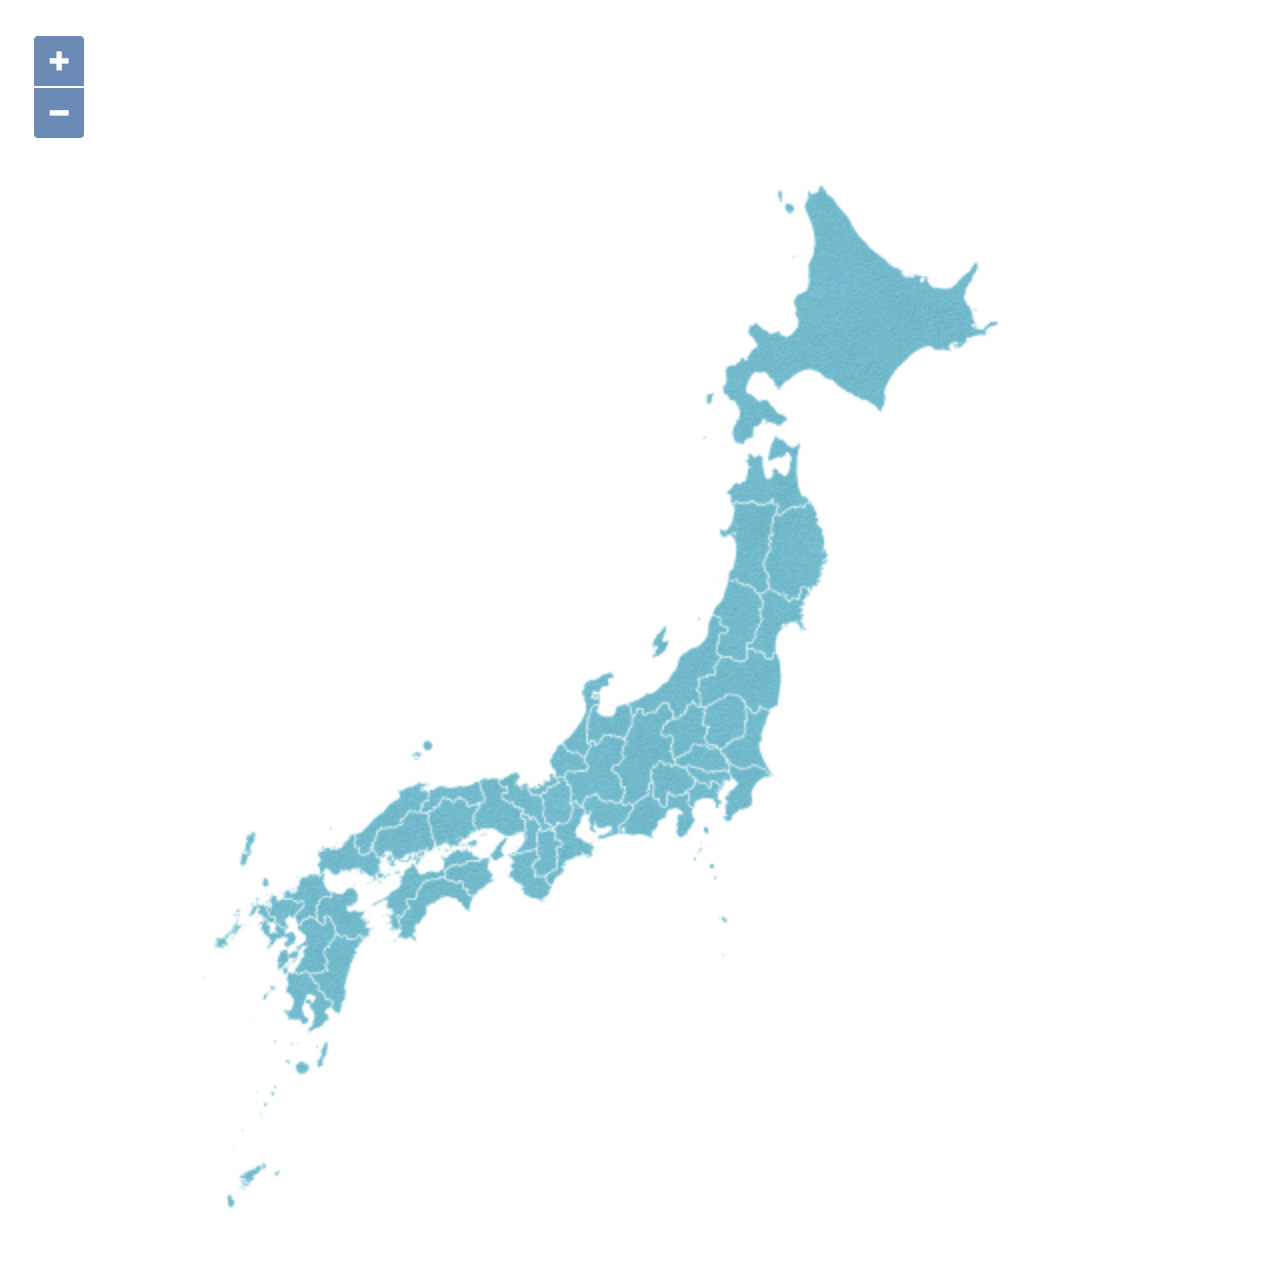
需要注意的是,指定填充图片的路径为/var/share/icons/icon-blue.png,它其实是由代表共享目录的/var/share和icons/icon-blue.png两部分组合而成。因为在负责渲染的微服务中,共享目录会被挂载为容器中的/var/share路径,这是特别需要注意的地方。
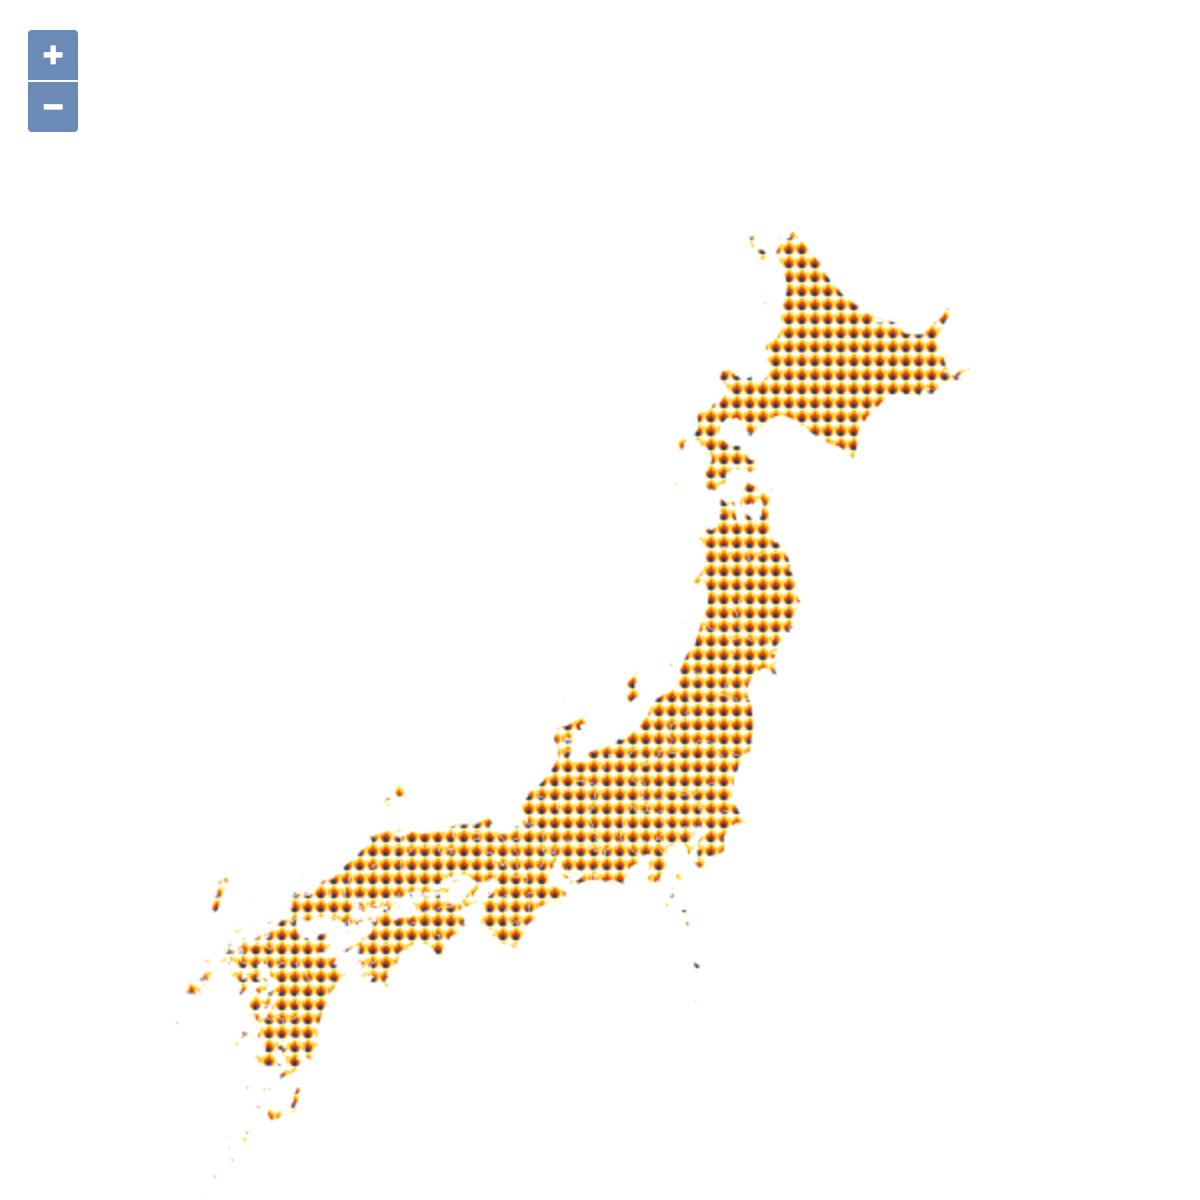
# 3. 使用 SVG 进行渲染
除了使用图片,还可以使用矢量的 SVG 来进行渲染。比如我们准备了一个名为icon-fire.svg的图标:
![]()
替换掉渲染样式中的fillFile属性,这时页面效果会变成这个样子:
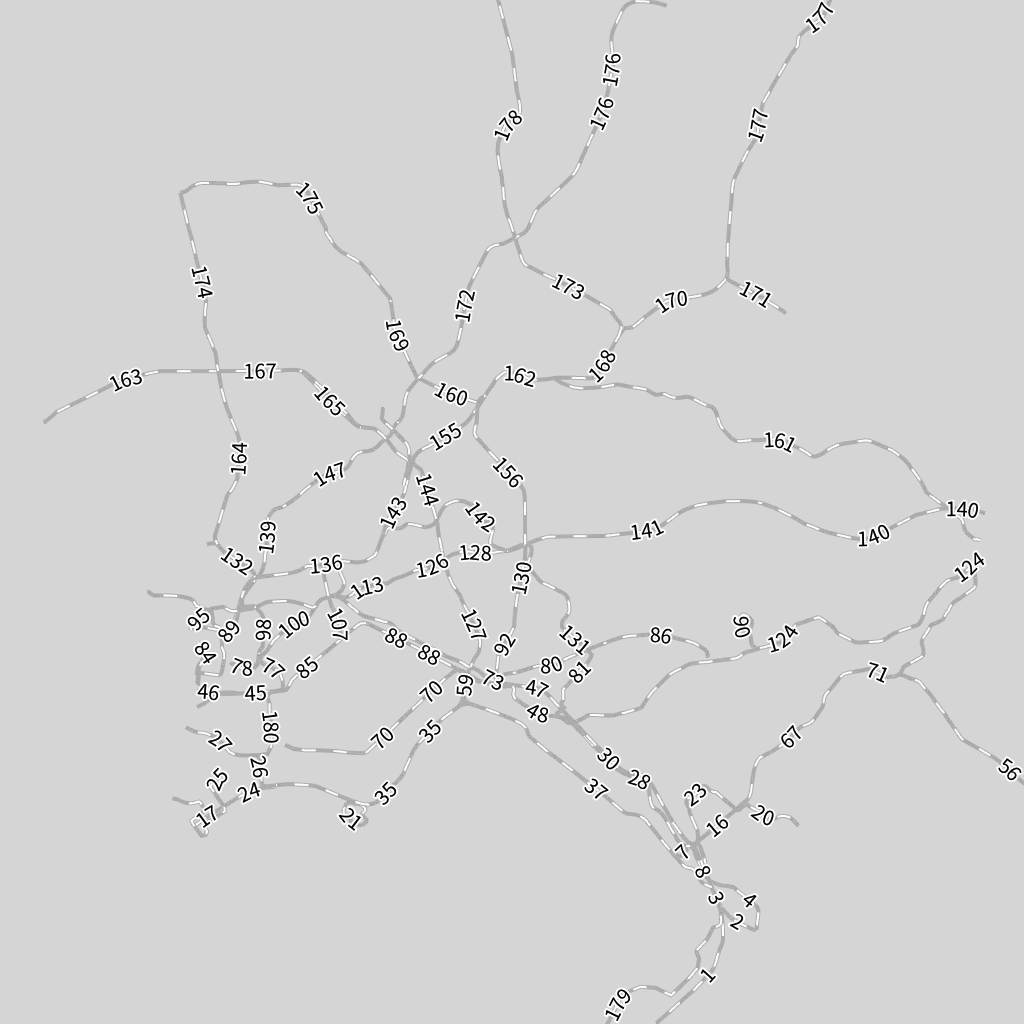
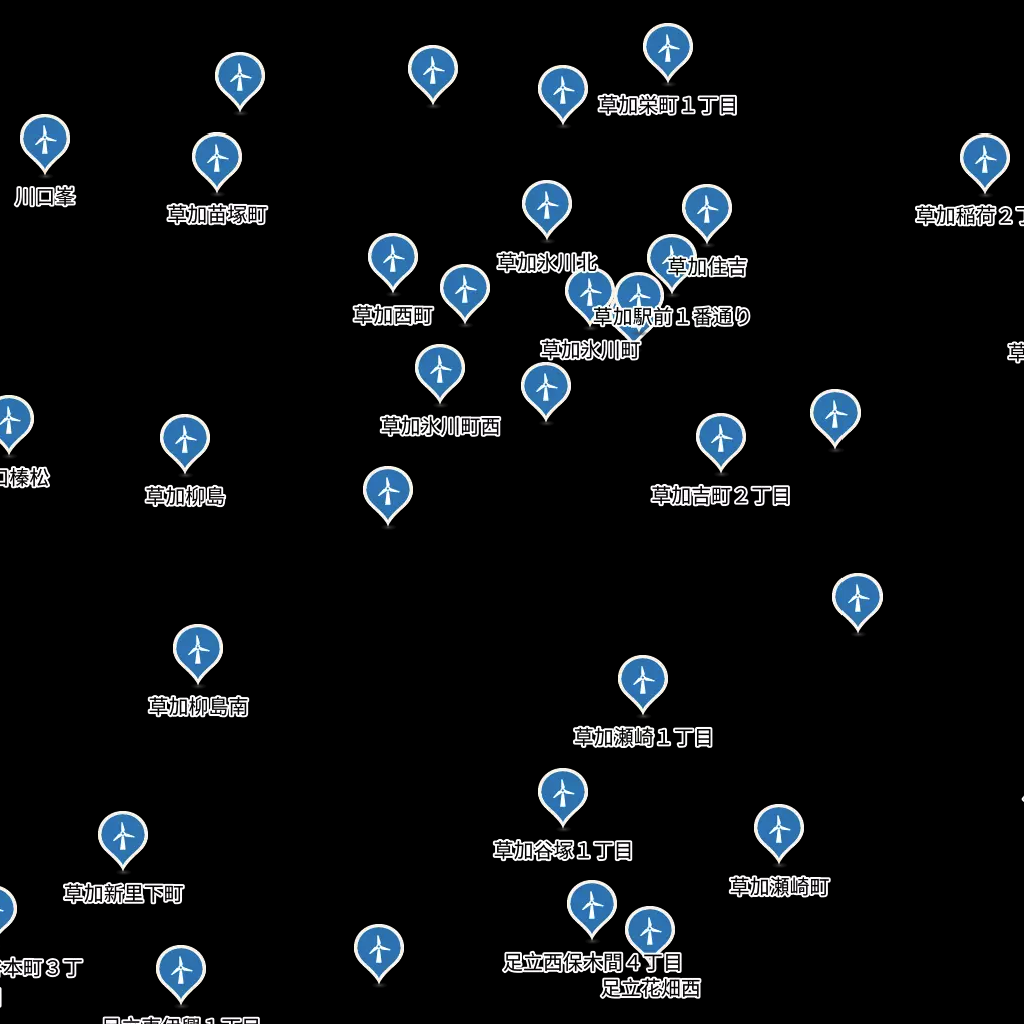
# 4. 用自定义图标渲染点数据和线数据
图片和 SVG 同样也可以用于点数据和线数据的渲染,分别通过指定渲染样式中的markerFile和lineFile属性即可。下面是点数据和线数据使用自定义图标进行渲染的效果:
![]()